Making the Most of Real-time Data
If you’re using your Daktronics video display’s real-time data (RTD) frames, you can easily customize your background and what information is shown on your screen.
10/7/2024
Categories: High School Sports
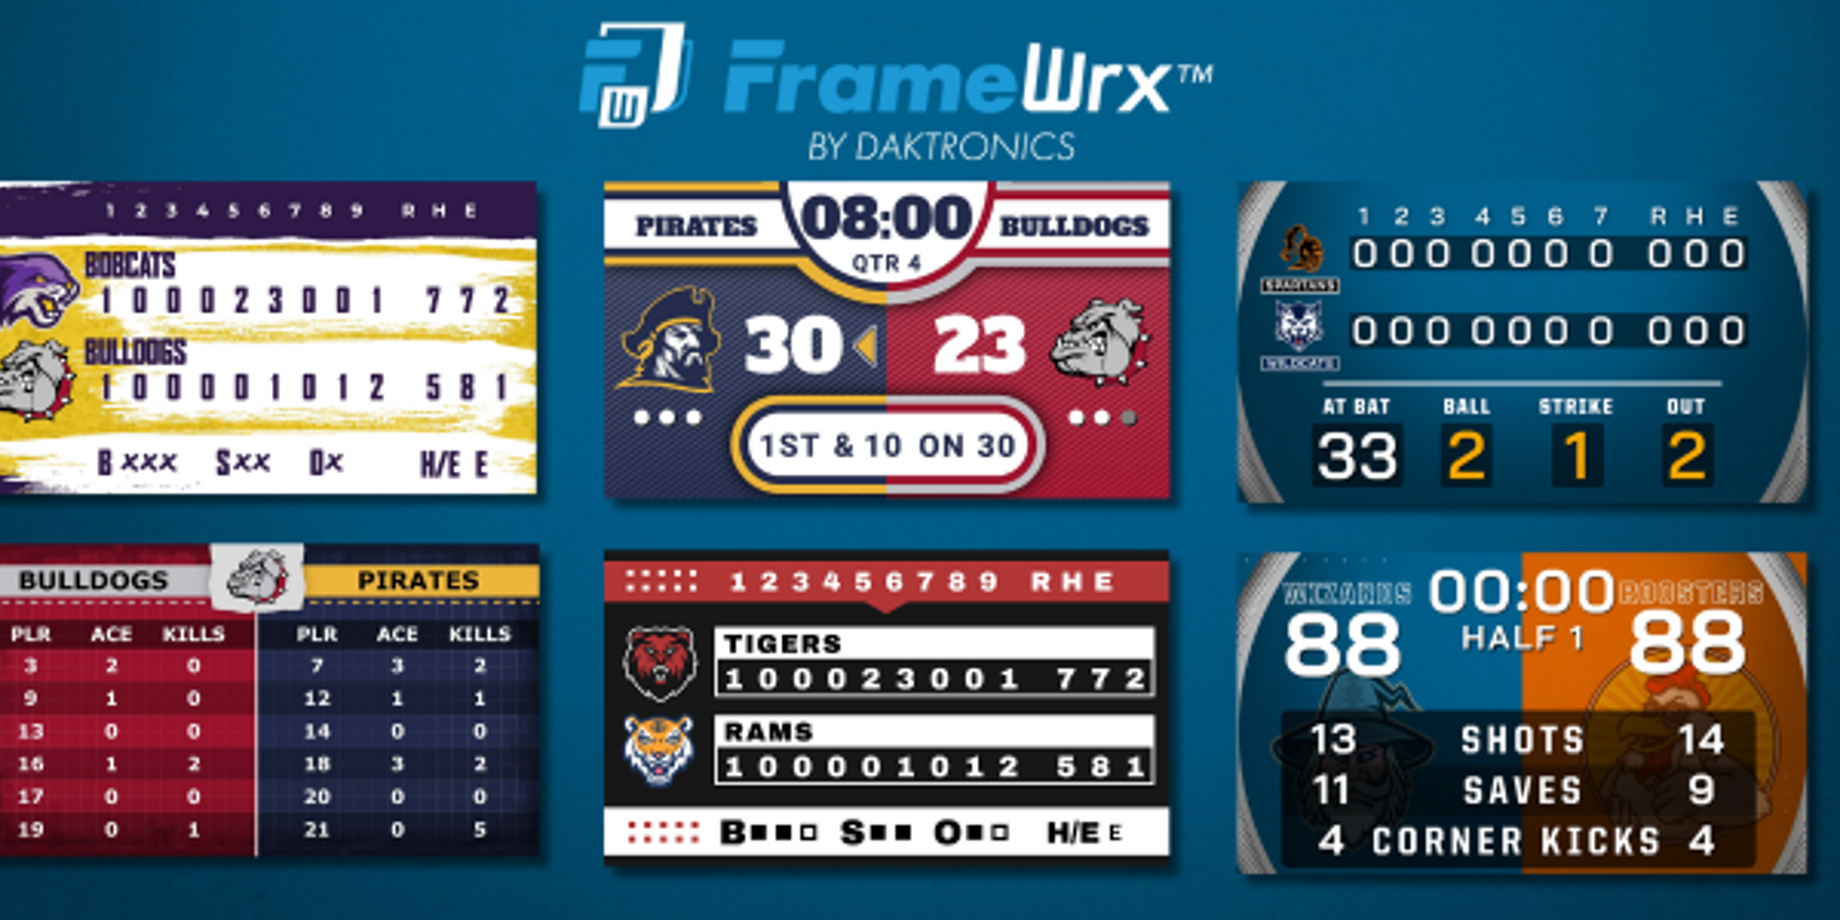
The universal scoreboard design is timeless, but changing the theme of your display each year can give your school a modern, cohesive look.
Here are some ideas to design appealing layouts for RTD (real-time data) for your display.
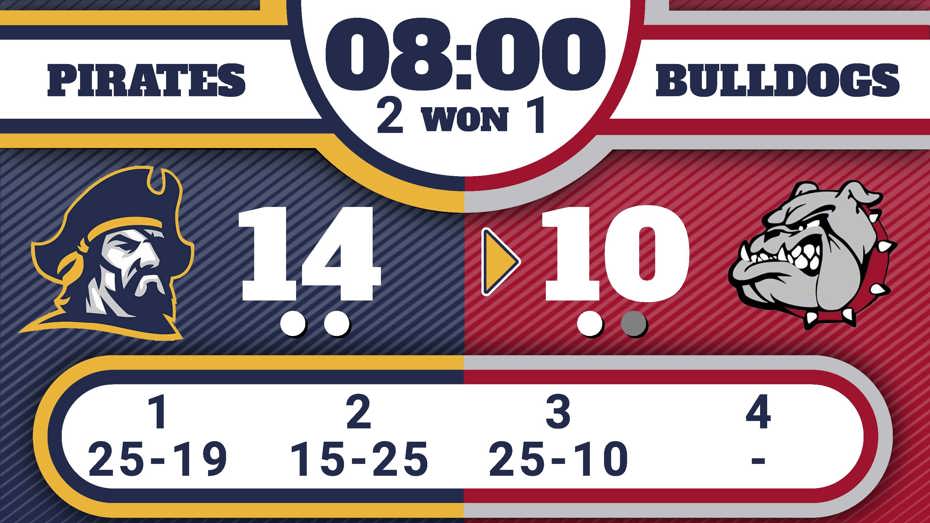
COLOR
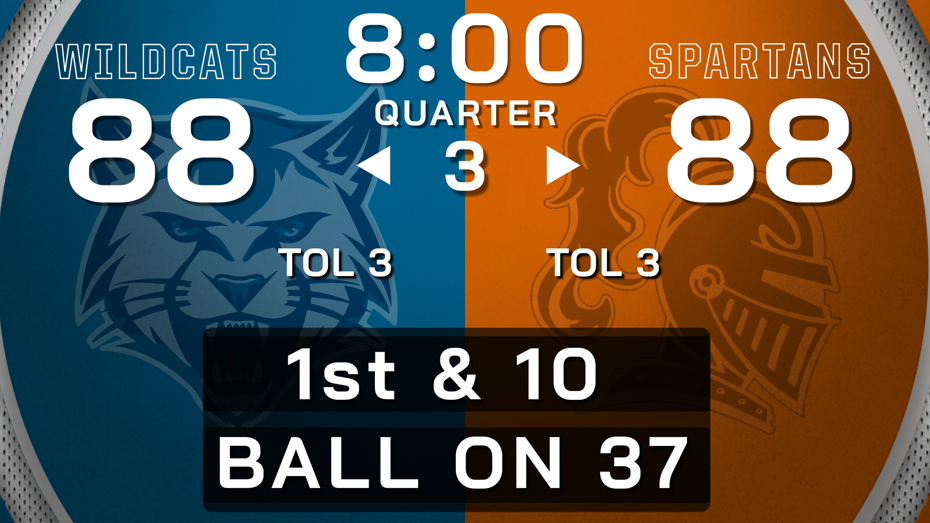
Contrasting colors will help your statistics stand out to the audience. For example, using a dark background with light text is easy to read so the crowd can focus on the game. Showcase your school colors to gain a home-field advantage and rouse school spirit.
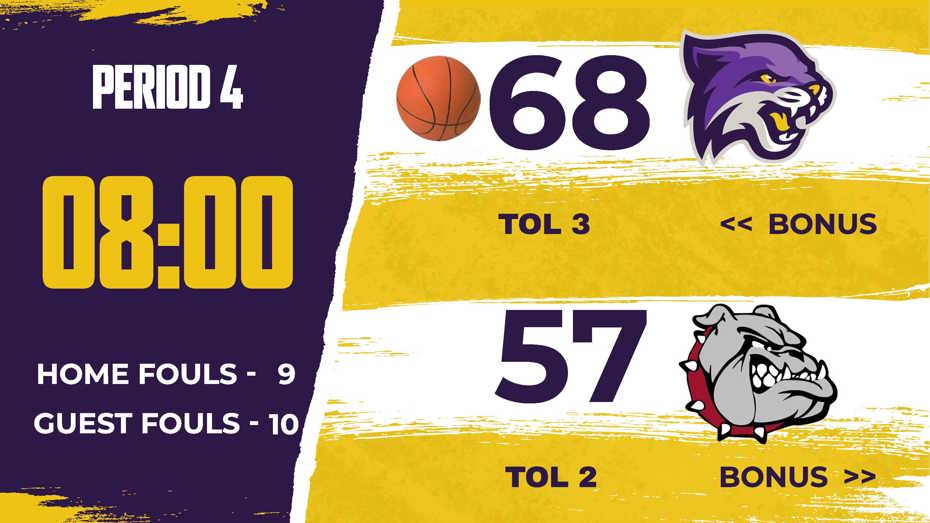
READABILITY
A bold sans serif font is the cleanest option for maximum readability when displaying statistics. Adding a border around elements like sponsored content can set ads apart from scores.
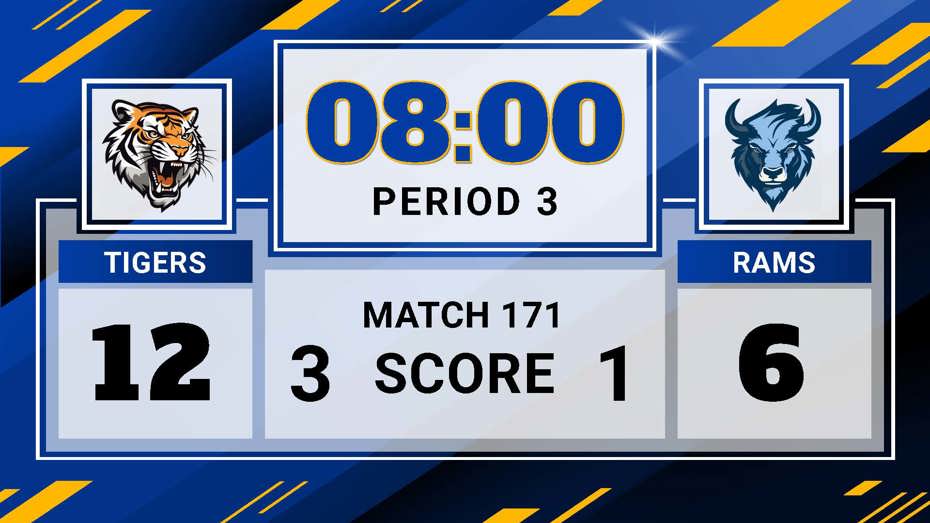
GRAPHICS
A design that is clean and well-balanced makes your display look more professional. Add weight to the most important words and stats to make sure they stand out.
CONSISTENCY AND HIERARCHY
A design that is well-balanced and doesn’t incorporate too many fonts or colors will make your display look more professional. Order the statistics by making the most important numbers and words stand out the most.
Having trouble coming up with a design?
Check out what other schools are doing with their video displays for inspiration.
Want to customize your displays with easily editable RTD stat templates?
FrameWrx is the perfect solution, with 350+ stat templates that are easy to customize with your school colors, fonts, and logos.
